A Look at Academia
Scott Galloway's predictions for Universities in a changing world
Over the past few months, "social distance," "N-95", "respiratory droplets," and "pandemic" have entered into the everyday language of Americans. While we await the development of a vaccine and/or treatment for COVID-19, society has felt the economic impacts of the pandemic and there will no doubt be aftershocks when the pandemic is over. Since deciding to be enroll in a PhD program, I have tried to become more conscious about the state of Academia. One thing that has caught my eye has been the economic impact that the pandemic has had on colleges and universities.
While we all have been worried about whether we will get to have in-person classes or if athletics will occur, we cannot forget about the role that student enrollment and athletics play in raising money for the school. There has been a lot of discussion surrounding colleges that may not be able to sustain lower enrollments. To look at this, NYU Professor, Scott Galloway, compiled a lot of data to identify schools that are at risk. Give the original post a read as he does a very good job explaining it all.
But as an aspiring scientist, I have an interest in data representation and am really interested by universities in the State of Florida. So I downloaded the data, and cracked it open the second I clocked out of work,
The Study
So first and foremost, what are we looking at??? Well the study looked at 435 colleges/universities throughout the country, with 11 Florida schools. Those included are University of Florida, Florida State University, University of Central Florida, University of South Florida (Main Campus), Florida Atlantic University, University of North Florida, University of Miami, Florida International University, Florida Institute of Technology, Nova Southeastern University, and Eckerd College. While I wish FAMU/FGCU/B-CU/UWF could be included in this, the US News & World do not include these schools in their "Top National College Ranking" which is used in the calculation.
This study looks at 2 calculated factors: Value-to-Cost Ratio and Vulnerability Score. These will be explained here (feel free to skip this section if you don't care about how they calculate these values).
This is a calculated value of education at a school divided by the yearly tuition, how much bang for your buck at each school. But how do you calculate the value of your education? There are there scores used (which each have a number of components).
Value-to-Cost (VTC) Ratio:
This is a calculated value of education at a school divided by the yearly tuition, how much bang for your buck at each school. But how do you calculate the value of your education? There are there scores used (which each have a number of components).
- Credential Score: taking into account US News & World National College Ranking, Undergraduate Admission Rate, and average monthly Google searches of the school
- Experience Score: assign a value to the Student Life Score from Niche.com
- Education Score: taking into account the 15-year and 30-year Net Present Value (I know this is essentially "Return on Investment", but I don't really understand it) and the Total Instructional Wages per Full time student (ie how much the school invests into physically teaching each student)
Each of these scores are standardized to 3.0 points each and are multiplied together to get a value between 0 and 27 for each school.
Vulnerability Score:
This is a made up number to try to quantify how vulnerable a school is to the economic effects of COVID-19. Note that this isn't vulnerability to the virus itself, but just of the economic effects. There are two components to Vulnerability, which comprise of how much money the university has.
- Endowment per Student: How big is the school's bank account and how many people do you have to spend it on?
- Percentage International Students: How much of your student body who pays Full-Tuition will be more likely to decide NOT to travel to the COVID-19 Hotspot of the World?
These are standardized and added together for a value between 0 and 2.
Quadrants
Now, you simply standardize these scores to the Median values and plot them on a graph with these two axes and you have your graph. Schools will plot within the four quadrants which predict how the schools will handle the pandemic's effects explained here
- Thrive: VTC = HIGH, Vulnerability = low. They'll be fine and may grow in the new academic environment.
- Survive: VTC = HIGH, Vulnerability = HIGH. Costs will have to be cut, but they'll make it through.
- Struggle: VTC = low, Vulnerability = low. They're going to feel the impact
- Perish: VTC = low, Vulnerability = HIGH. It doesn't look good for these schools
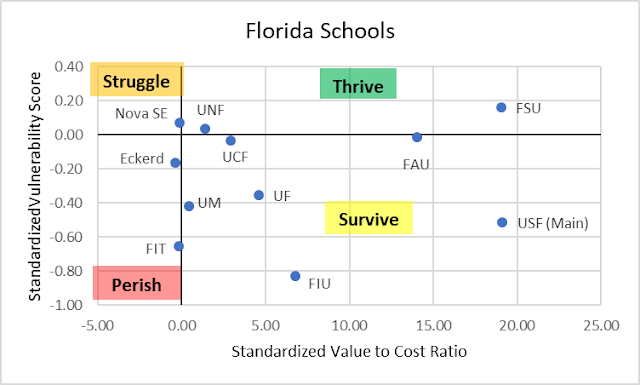
Florida Schools
Here's the thing that you actually wanted to read. Where do the Florida schools fall? Well here it summarized in a graph

Thrive: FSU, UNF
Survive: USF, FIU, UF, FAU, UCF, UM
Struggle: Nova Southeatern
Perish: Eckerd College, Florida Institute of Technology
Surprising Findings in Data
There are a few surprising things that I found in the data that I'll report here
- The SHOCKING difference in Value-to-Cost Ratio within the common Florida schools. USF and FSU actually have the #2 and #3 highest VTC ratio of all 435 sampled schools. This is due to a decent, above-average Value for both schools, but is mainly due to a low tuition. While this could diminish the weight of this stat, the Florida State University System prides itself on being affordable and FSU, USF and even FAU do a good job at showing this.

- The main thing separating schools' Value of UCF/FSU/USF from UF/UM is the Education Score. The main thing separating FAU/FIU/UNF from UCF/FSU/USF is the Credential Score

- Why are SO many people Googling UCF??? Is this a result of their undefeated football season where they became more of a household name?? Does this have to do with it being the #1 or #2 most populated University in the US (depending on the year)???

- Universities really rely heavily on International students paying full tuition. That just seems crazy to me
Comments
This was an interesting study to read, and it did a good job to characterize these universities and compare them to another. However, there were some things that stood out that make these stats difficult to stand alone.
- Many of the standardizations I keep talking about are essentially ranking the colleges relatively against another. So if 434 universities had an Undergraduate Admittance Rate of 50%, 1 had a rate of 51%, it would automatically get a 0.00 (out of 1.00) contribution to the Credential Score. Despite being very close to the other universities, it is in the bottom 0%.
- If more schools were included (i.e. the ones not ranked by US News & World National Top College Rankings), these metrics would shift extremely as this is based around median values.
- I always hate that Niche.com ranking system that takes into account things like "Party School," "Local Crime Rate", "Local Area Rating," etc. This study seems to weight it more than I would hope
- The "Education Score" is more of an Economics Score. For example, schools without Engineering programs have an inherent lower NPV to those that do because of those larger Engineering salaries (At least with my current understanding of NPV). But then again. I can't think of more effective way to truly measure "Education".
- I've realized this summer that I just really enjoyed looking into data. This isn't meant to be too serious, but rather just my initial observations when looking at a dataset that interested me
Comments
Post a Comment